During the New York session, the market behaves rather chaotic. Most of this is due to the end of the trading day or week. However, the high volatility of the American session offers a whole variety of trading opportunities. Breakout strategies are one of the popular trading methods during this period. Let’s take a look at one of such strategies.
About Strategy
There is no particular time to use the strategy, unlike the London Breakout strategy tied to the opening of the European session. If you don’t want to monitor the market during the entire trading session from 12:00 to 21:00 UTC, use the Bollinger Bands indicator.
This program was created by renowned trader and technical analyst John Bollinger. The indicator consists of three lines that gradually expand or contract depending on the market volatility level. A breakout through one of the Bollinger Bands signals a strong impulse. We are going to use these breakouts to build a successful trading strategy.
Main Details
There are just a few things to remember to make profits on this strategy:
1. Currency Pairs
The American session is famous for its unpredictability, so try to use the most stable currency pairs. Choose trading instruments with the highest liquidity. Moreover, pairs with the US dollar are best suited for the New York session:
- EUR/USD
- USD/CAD
- GBP/USD
2. Timeframe
The breakout strategy is an intraday strategy. You can use higher timeframes to identify the major trend. However, for this system, the major trend does not really matter.
To get the maximum number of trading setups, choose the lowest timeframes, such as five minute charts - M5.
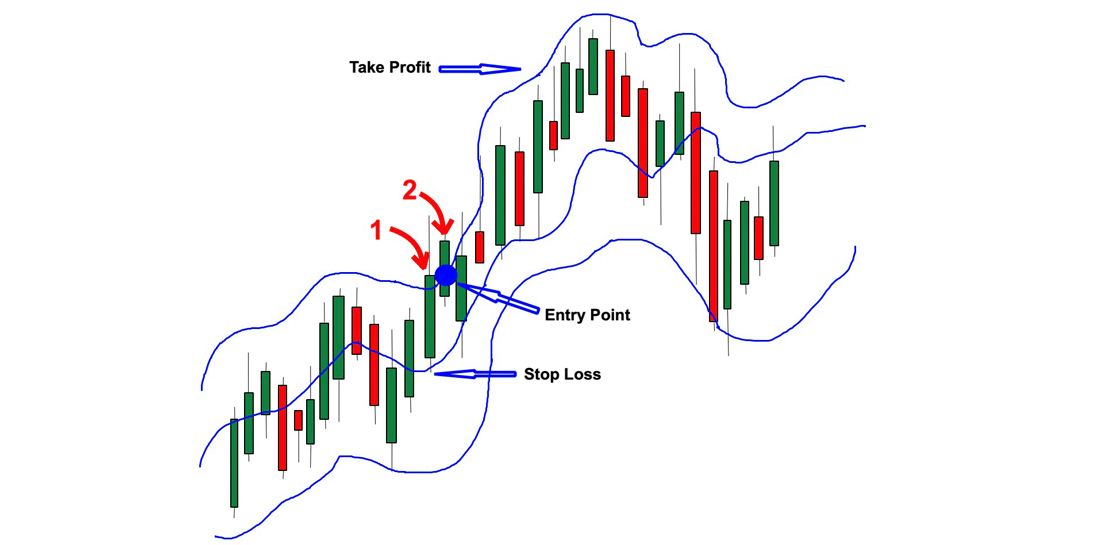
3. Entry point
The signal to open a trade is the breakout of the upper or lower Bollinger band. For a more accurate signal, wait for two breakouts in a row:
- When two candles break through the upper band of the indicator one after another, open a buy trade.
- When two candlesticks close below the lower Bollinger band, open a sell trade.
4. Exit Points
Stop Loss in this strategy is set right next to the opposite edge of the first of the two breakout candlesticks:
- When buying - right under the first candle
- When selling - just above the first candle
The distance to Take Profit will depend on your risk-to-reward ratio. If you trade at a 1:3 level, set your exit point three times the distance to your Stop Loss. At 1:2 level, the distance should be twice as large.
Final Words
Trading in any trading session has its pros and cons. When choosing a strategy, it’s important to consider these features. I hope that the strategies from my last three articles will help you make a profit in each of the trading sessions. Good luck!