Market analysis for beginners
Economic cycles
Economic cycles are regularly repetitive periods in the development of a market economy. The overall trend of economic growth is accompanied by periodic fluctuations in economic activity: alternation of contraction and expansion of production, investment, decrease and increase in income levels, employment, prices, interest rates, rates of securities. The cycle of economic activity consists of four phases: Expansion, Peak, Recession and Bottom.
Expansion
After reaching the lowest point of the cycle there is a phase of recovery, which is characterized by the growth of employment and production. Many economists believe that this stage has low inflation until the economy begins to operate at full capacity or, in other words, until it reaches a peak.
Peak
A peak, or top of business cycle, is the highest point of economic recovery. At this point, unemployment reaches the lowest level or disappeared entirely and the economy operates with maximum (or close to it) load, that is all of the country's capital and labor resources are engaged in the production. Usually, though not always, during the peak inflationary pressures increase.
Recession
A recession is a period of reducing output and business activity. As a result of contracting market, decline is usually characterized by growing unemployment. Most economists believe that economic downturn or recession is only a drop in business activity, which lasts six months at least.
Bottom
Bottom of economic cycle is the lowest point of production and employment. It is believed that the achievement of the bottom predicts the end of the recession as this phase of the cycle is not long. But history knows and exceptions to this rule. The Great Depression of 1930s lasted for nearly ten years.
Long cycles are economic cycles with duration of more than 10 years. Sometimes they are called by names of their researchers.
- Investment cycles (7-11 years) are studied by Clement Juglar;
- Infrastructure investment cycles (15-25 years) are studied by Simon Kuznets;
- Series of Kondratieff (45-60 years) are described by Russian economist Nikolai Kondratiev;
- Cycles of Forrester (200 years) are described by American engineer Jay Forrester.
Cycles of economic activity are varied and differ in their duration, duration of individual phases, maximum's heights and minimum's depths. In the current conditions, smoothing of cyclical fluctuations and business activity are noticed and intervals between crises become longer, their depth and destructive power reduce. Most often, a crisis is superseded by milder form -recession.
Although it is considered that changes in business activities are directly or indirectly related to economic cycles, there are other factors affecting the economy. The most important of these are seasonal fluctuations and long-term trends. The influence of seasonal variations is observed at certain times of the year, for example, shortly before Christmas or Easter when business activity increases dramatically, especially in the retail trade. In other industries such as agriculture, car industry and construction there are also seasonal variations. Secular trends determine long-term increase or decrease in economic growth.
The economic cycle is often associated with changes in output volume. Many economists believe that output is usually measured by gross domestic product (GDP) and the most reliable indicator of the economy. It is important to note that an economic cycle in the phase of recovery is evident not in an increase in GDP, but paces of this increase. Negative values of growth rate over a certain period of time, usually six months or more, are considered as a sign of slowdown in the economy. In contrast, the consistently high, from month to month, growth rates show that the economy is booming.
Cycles of economic activity are related to small economic cycles of 10 years. They are developed against a background of a large cycle of economic development of up to 50-60 years. Large cycles are identified by Russian economist Kondratyev. They consist of upward and downward fluctuations in economic conditions, each of which lasts for up to 30 years. Large cycles are based on revolutionary changes in technologies, design and production needs. The transition to post-industrial society in the developed countries coincides with the fifth longest wave of the Kondratyev cycle. The beginning of the upward phase is associated with the restructuring of the economy based on high-profile and science-intensive technologies.
Chart analysis
A price chart is a sequence of prices plotted over a specific time frame. In statistical terms, charts are referred to as time series plots.
Types of price charts
There are three types of charts:
- Line (Fig.1)
- Bars (Fig.2)
- Candlesticks (Fig.3)
2 and 3 give more detailed information such as the open, close, low and high over a specific time frame.


Support and resistance
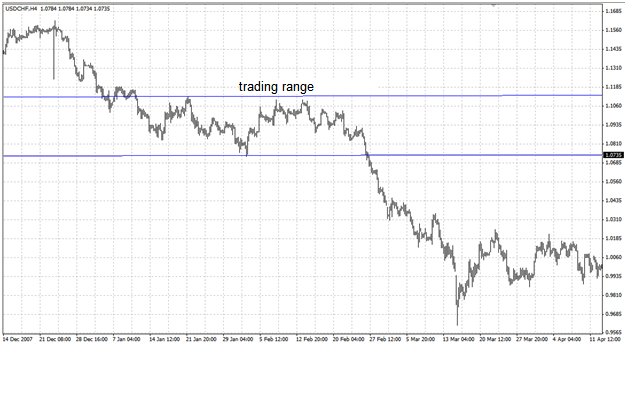
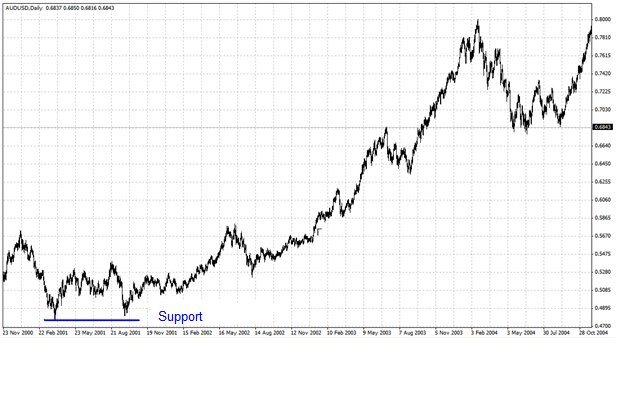
The support and resistance line/level is a certain level reaching which the price cannot fall or move higher, respectively. In any market with a stable trading range prices will meet resistance and support levels. In other words, when the price reaches a certain level, the bulls or bears begin aggressive buying or selling, because they do not agree to any level, and at some point supply and demand in the market are equal, thus forming resistance or support lines. However, if there is an upward or downward breakout of a trading range, the previous support level becomes the level of resistance (Fig. 4), and the level of resistance, on the contrary, becomes the level of support (Fig. 5).


In addition to trend lines, the low and high can serve as support and resistance levels (Fig. 6 and Fig.7). However, the previous high or low does not mean that it is the level from which the price will leap back. They tell us that when price moves close to them, it may meet the level of support or resistance near the low or high because the market remembers that there was parity between the bulls and bears at this level, and when the price is close to the level of support all start buying, and when approaching the level of resistance, on the contrary, start selling. A breakout of the previous minimum or maximum can be considered as a signal to further fall or increase in prices.

The criterion for a breakout of support and resistance levels can be a chain of 2-3 closures below or above these levels, respectively, as common breakout still did not mean anything (Fig.8). The above criterion is confirmation of a temporary duration. There are several approaches to definition of criteria: breakout depth, price values coming out of support or resistance levels.

Bars (Fig.9), candlesticks (Fig.10), the lows (Fig.11) and highs (Fig.12) can also serve as support or resistance lines.


Trend
Trend is an upward or downward tendency which is characterized by a strict consequence of higher maximums and minimums, in case of upward tendency, and lower minimums and maximums, in case of downward tendency. An uptrend is considered not to be broken till the previous high or low is not broken through. In other words, the next high or low is lower than the previous one. It is the necessary criterion for an upward tendency. A downtrend is considered not to be broken till the previous low or high is not broken through.


Trading range
Unlike a trend, a trading range represents a horizontal tendency in which a sequence of the highs and lows are almost in the same level. It also includes price fluctuations over long-lasted period of time. A trading range is considered to be broken if its upper or low boundary has been broken through. (Fig.15)